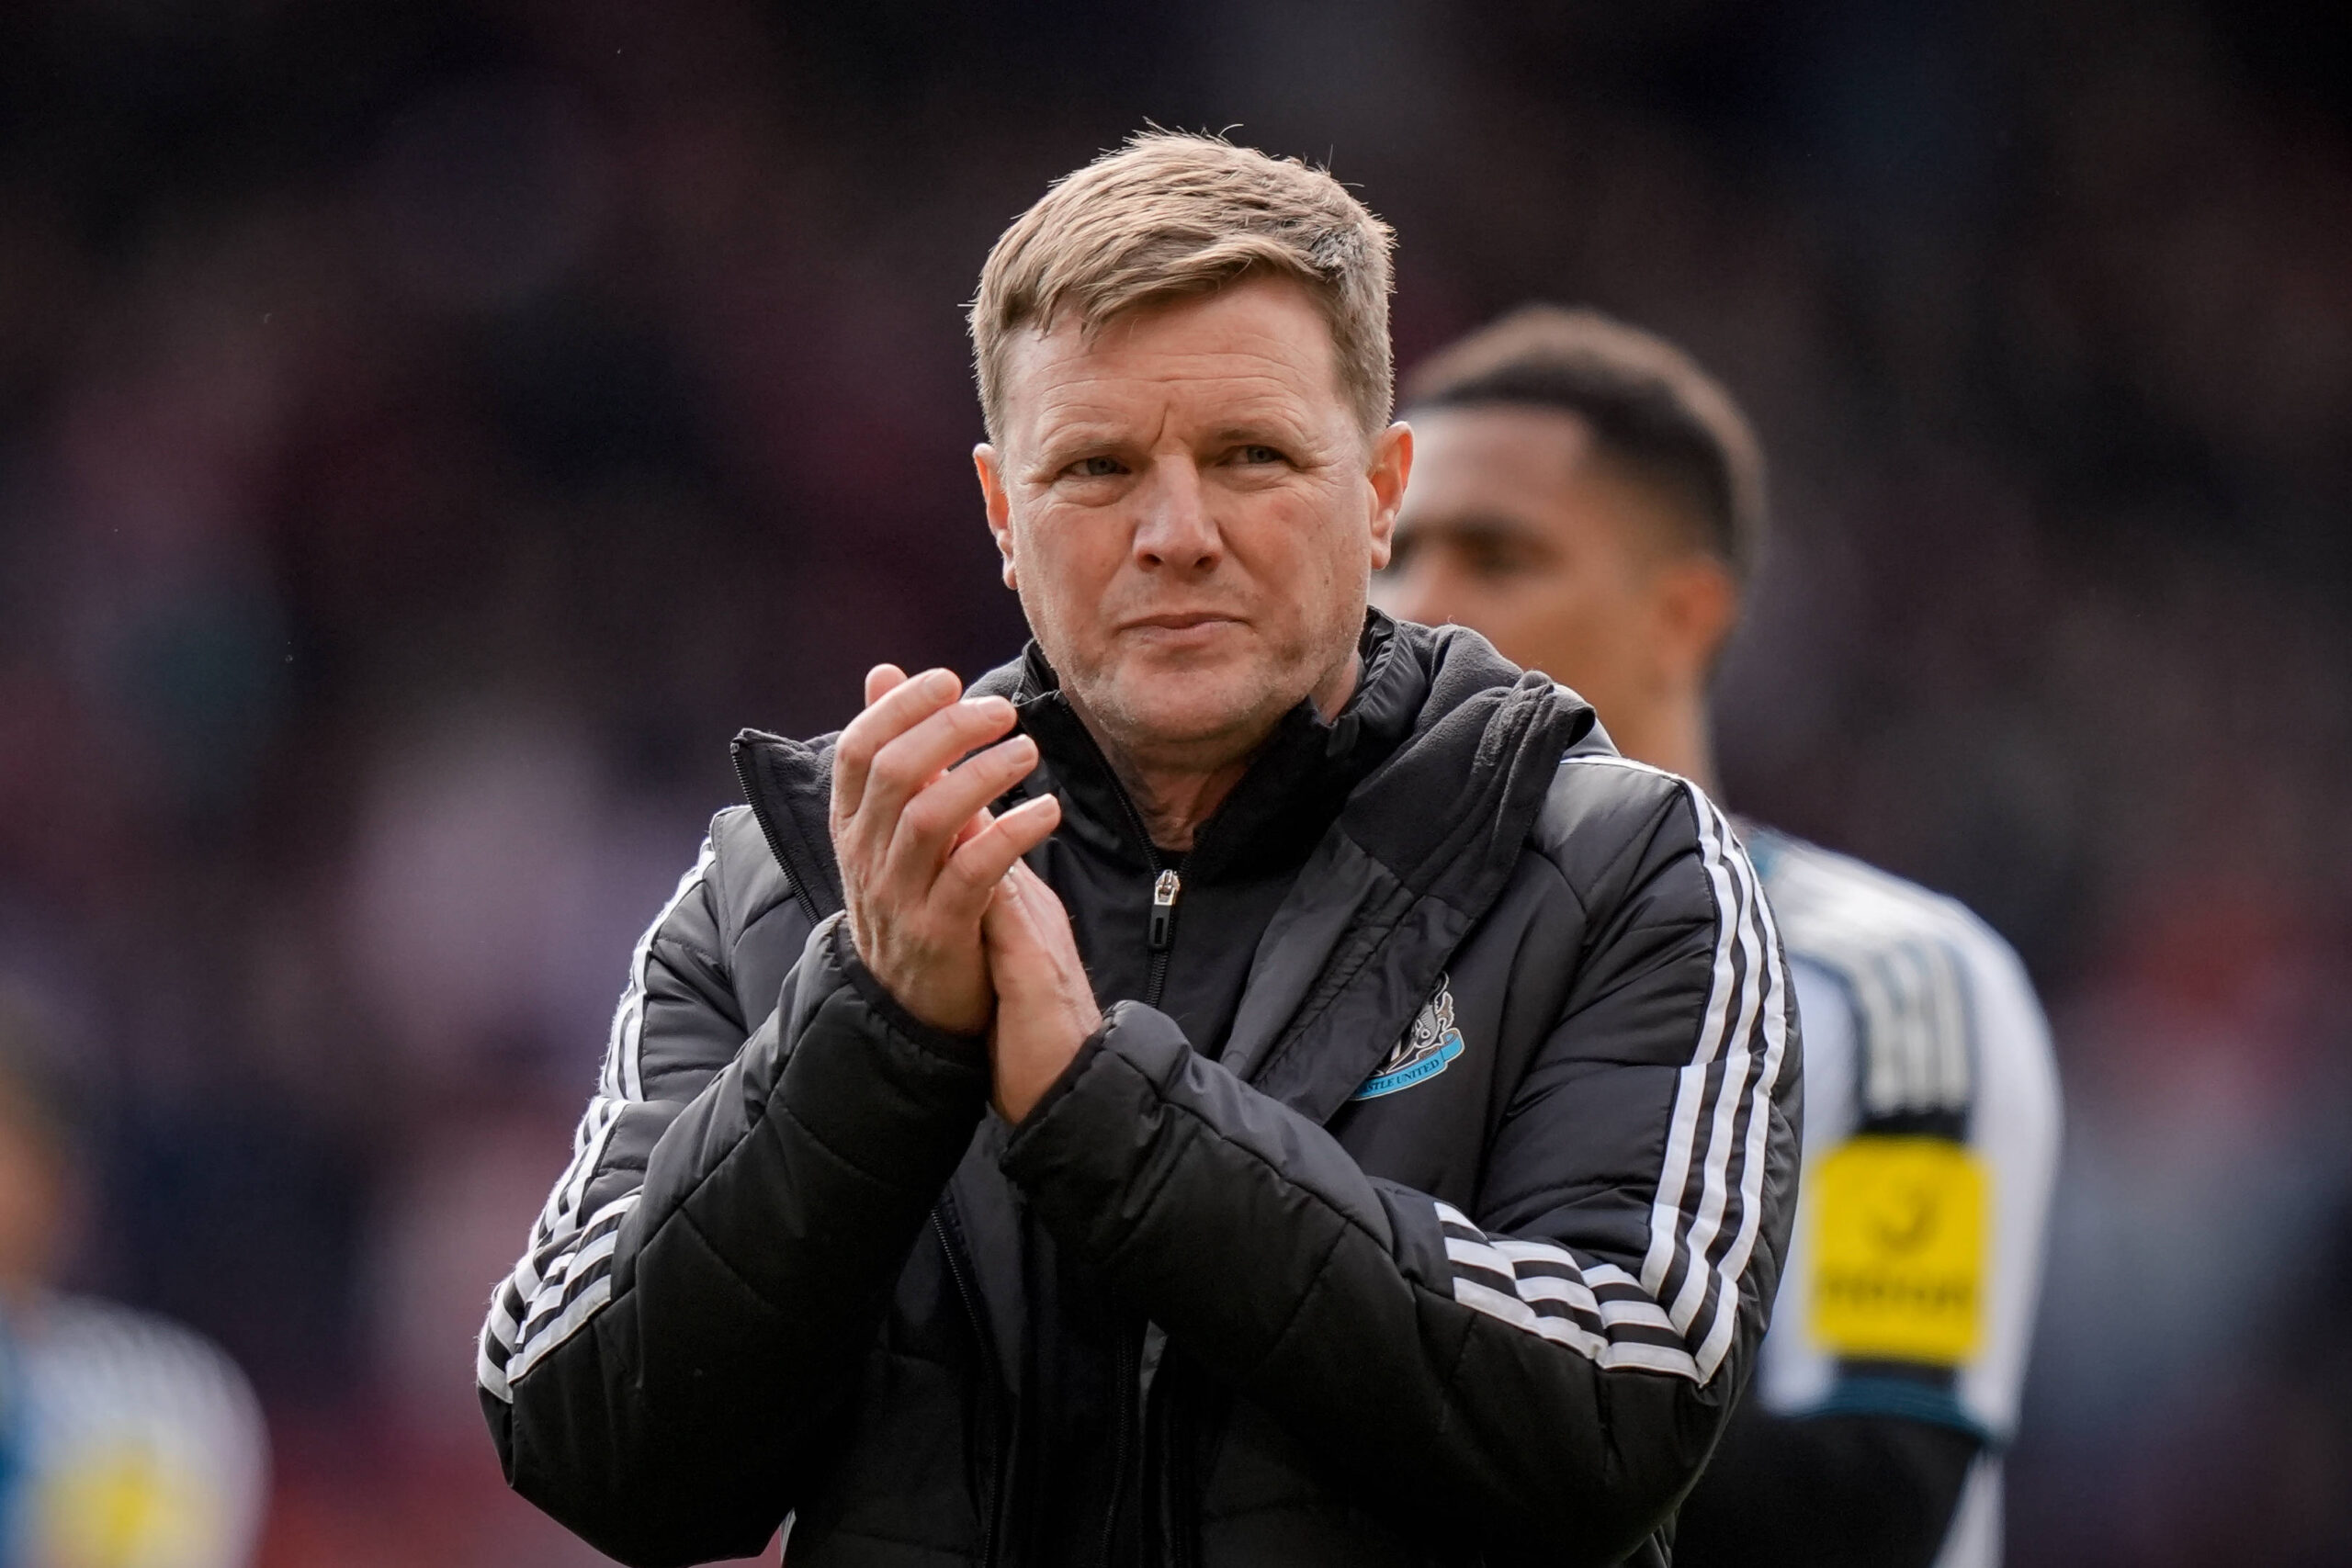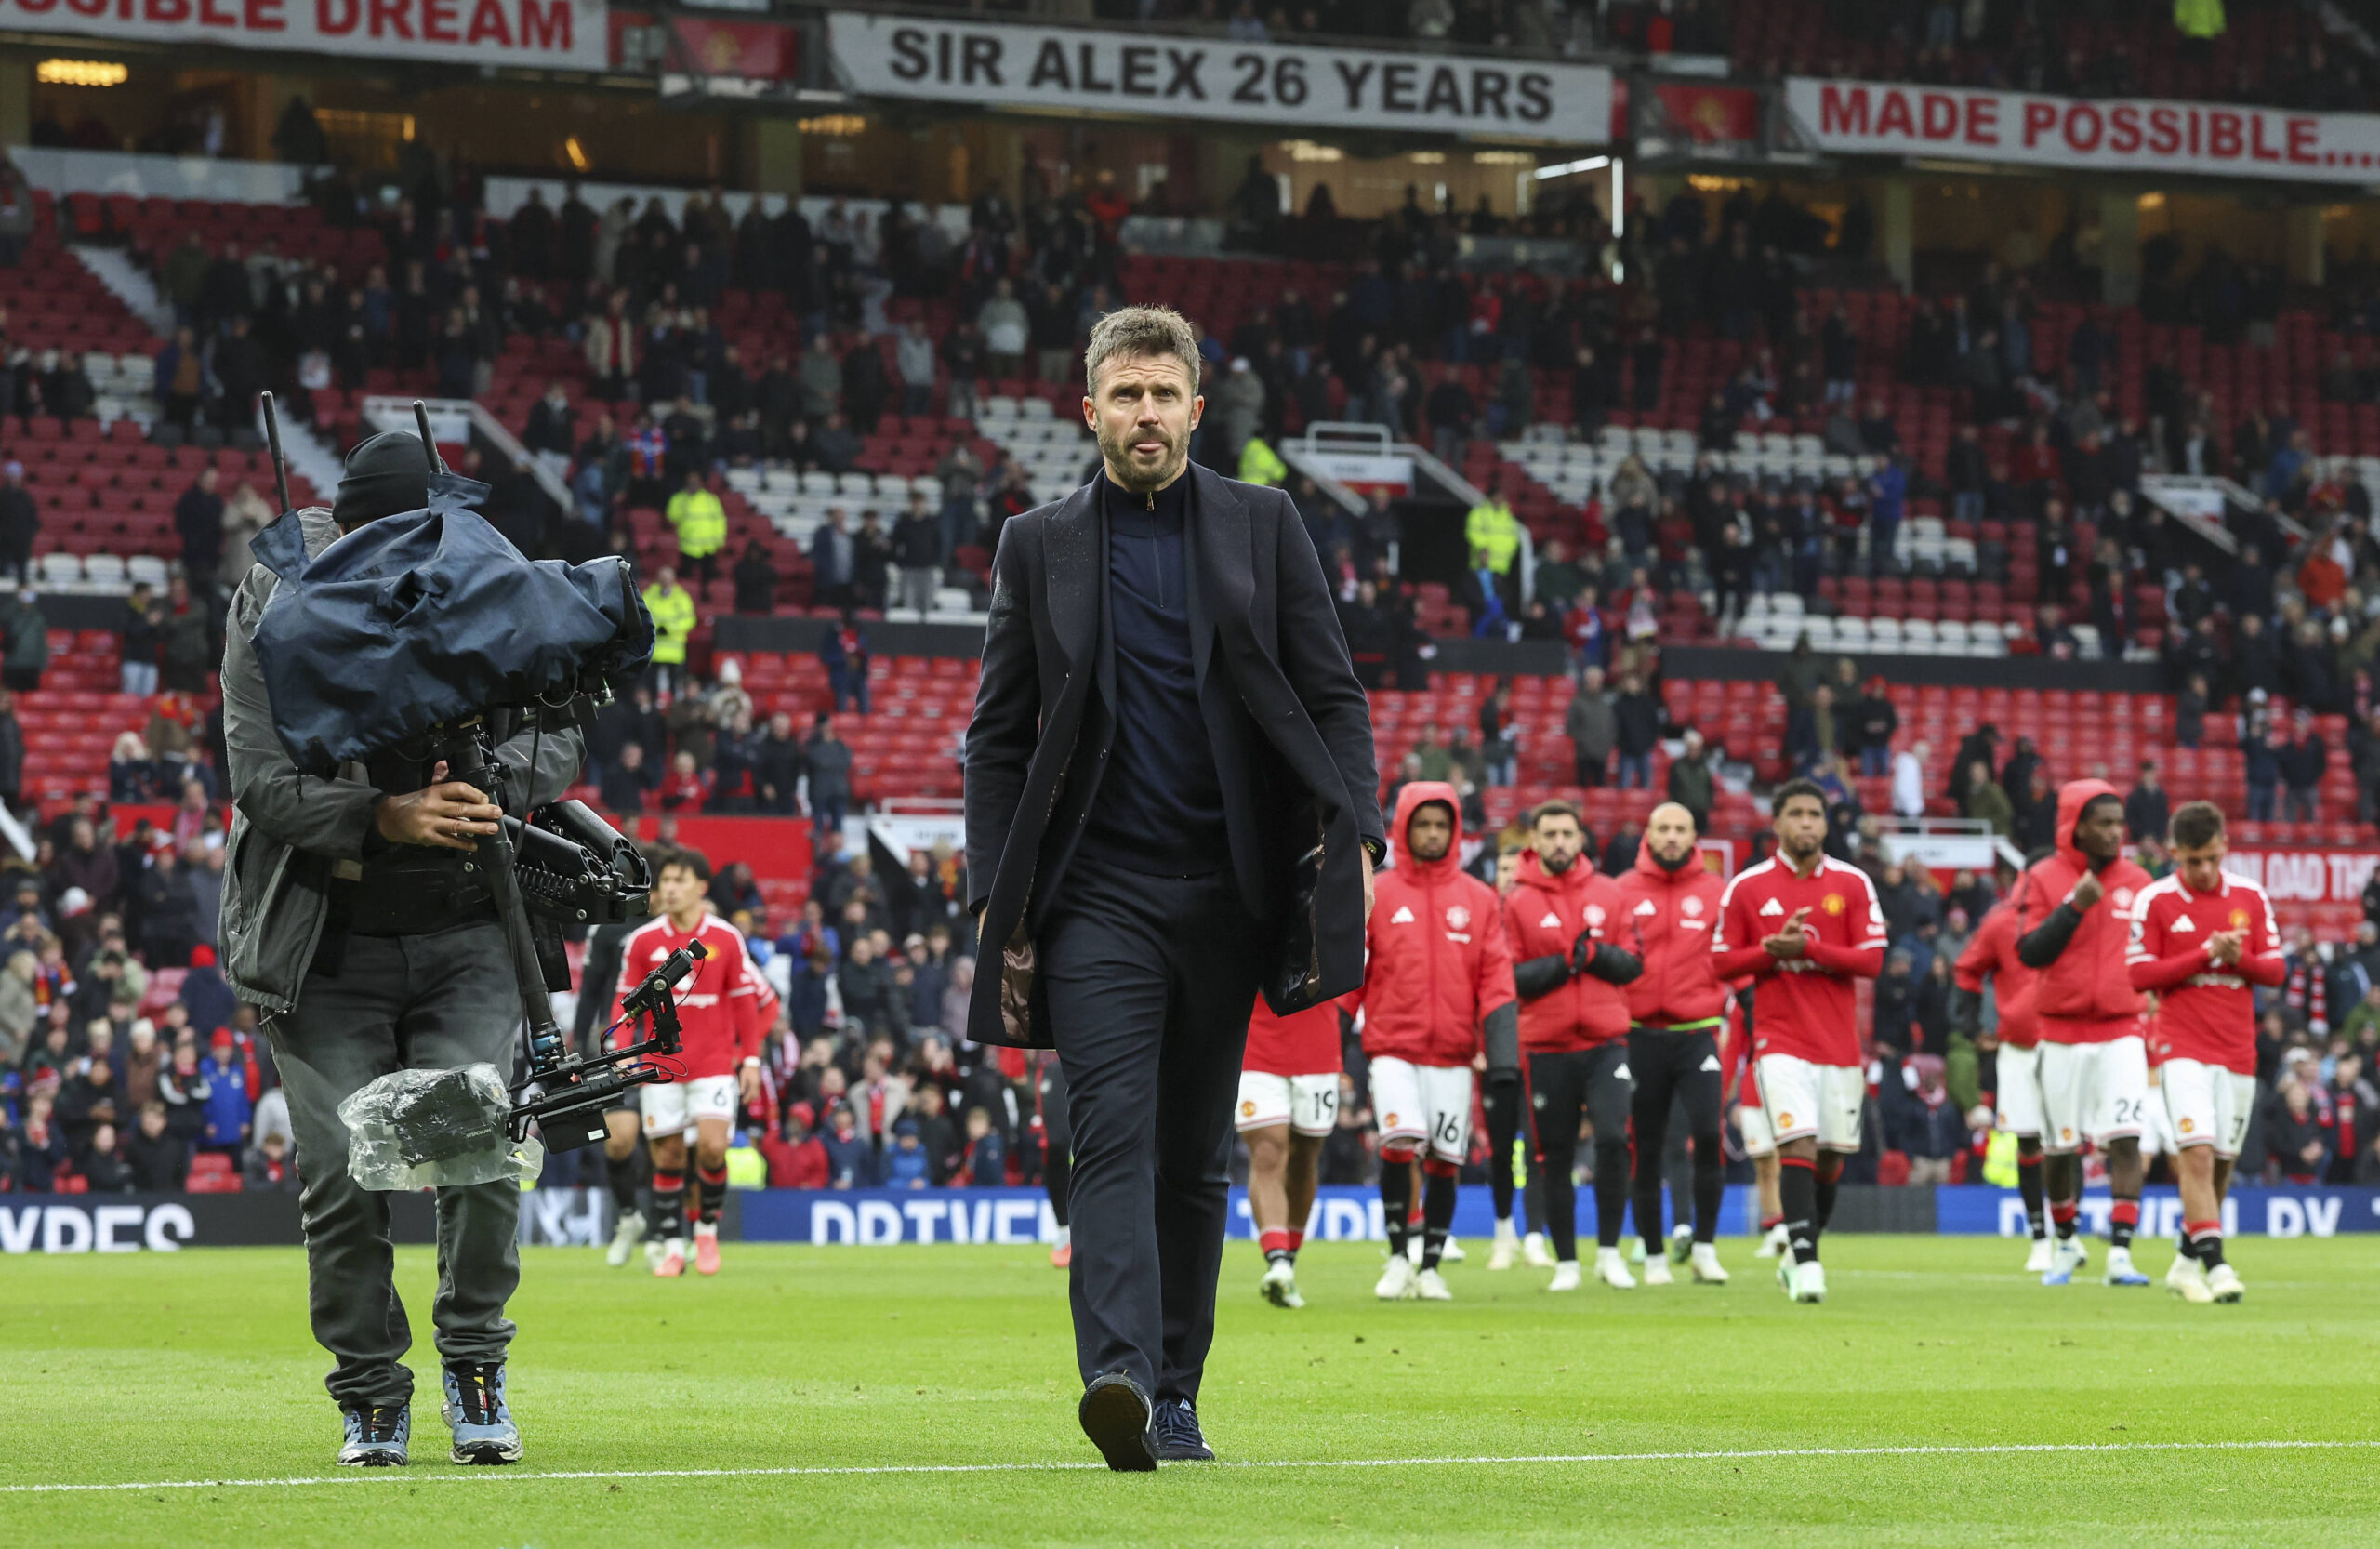
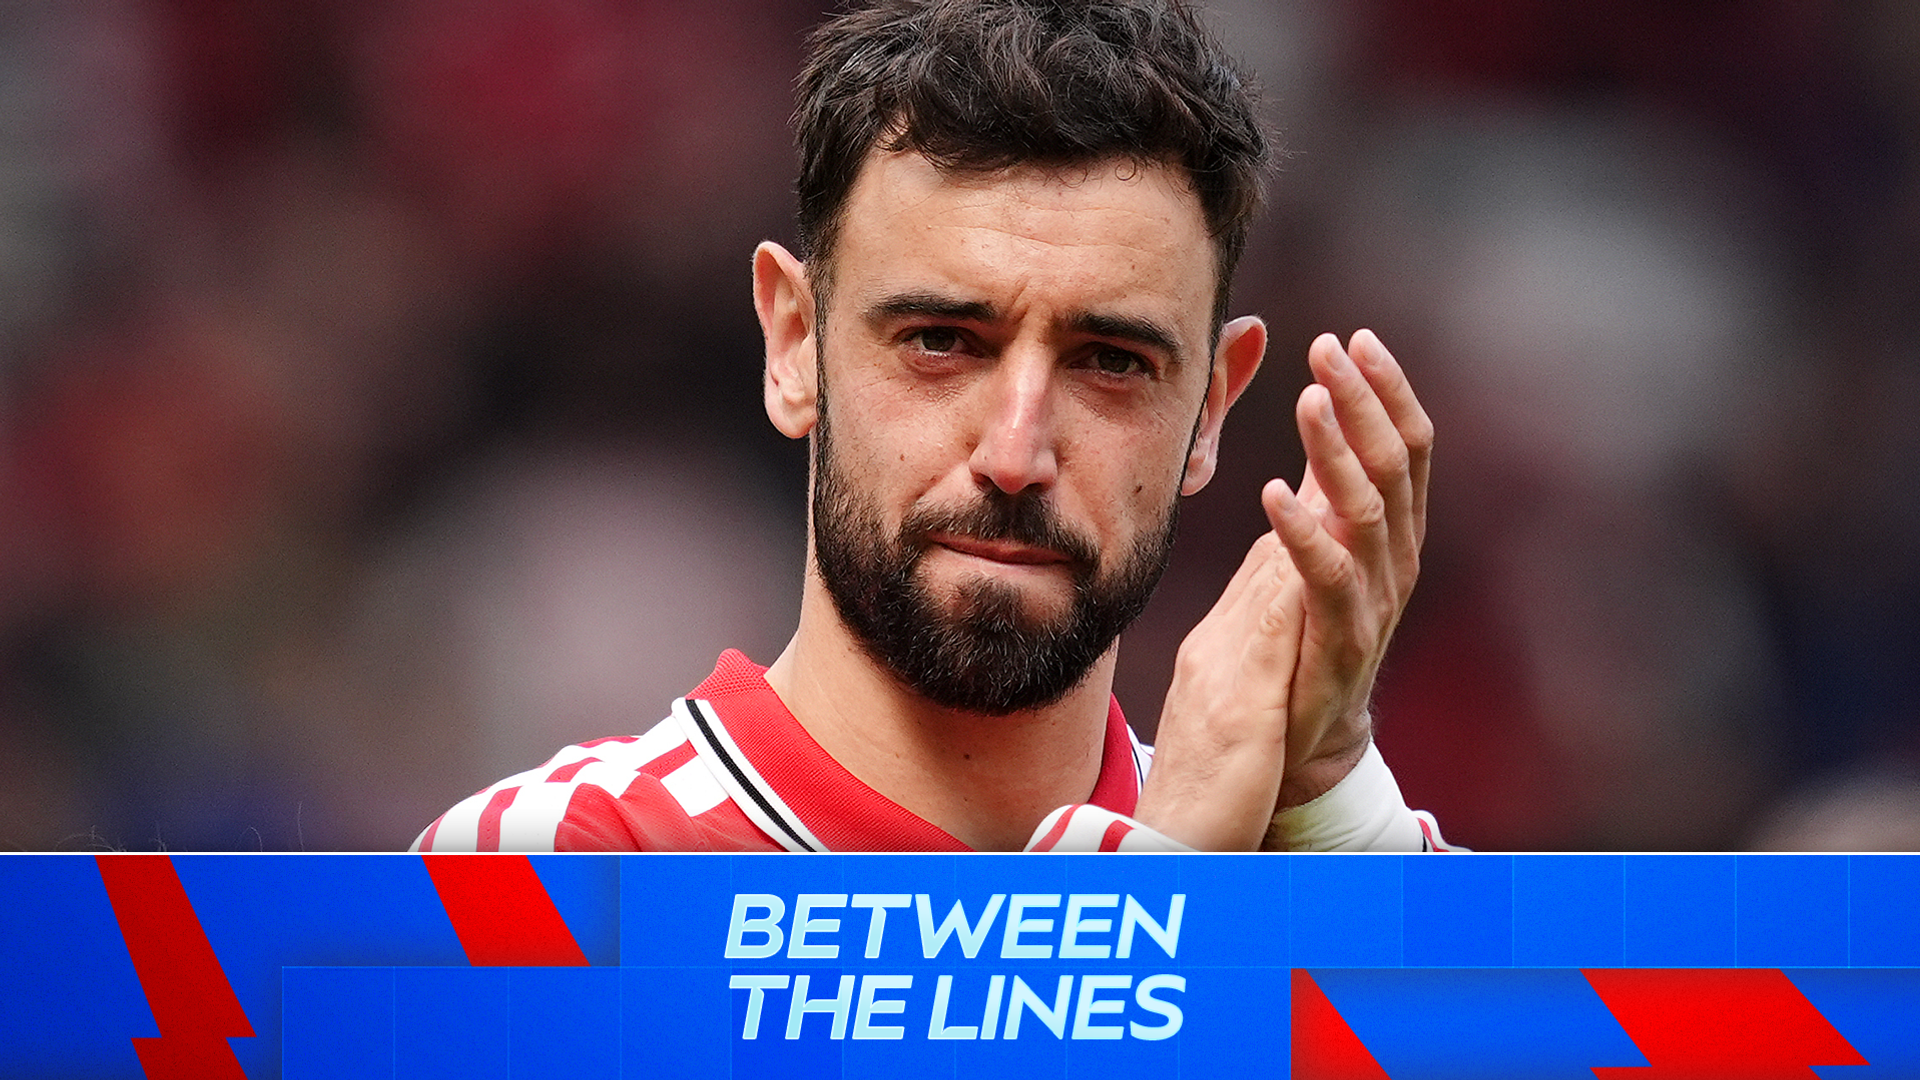
Manchester United's managers have consistently overperformed, but poor recruitment has left them mid-table
Manchester United have taken 56 more Premier League points than expected since 2016, yet their average expected finishing position is ninth. The underlying numbers suggest the club's problems run deeper than the dugout, with recruitment under scrutiny after a net spend of £1.4bn.
- Points overperformance: 669 actual points vs 613 expected since 2016 – fifth-highest tally in the league.
- Net spend: £1.4bn since 2016 – 40 per cent higher than any other Premier League club.
- Expected finishing position: Average of ninth between 2021/22 and 2025/26.
- Managerial record: Michael Carrick is the eighth permanent boss since Sir Alex Ferguson retired in 2013.
- Recent result: 3-0 home defeat to Bournemouth increased pressure on Carrick.
- Key figures: Christopher Vivell (head of recruitment) and Jason Wilcox (sporting director) now under scrutiny.
The numbers
- 669 – Manchester United's actual Premier League points since 2016, the fifth-highest in the league.
- 613 – Their expected points total, meaning they have won 56 more points than expected.
- 56 – The overperformance margin; only Everton have a larger overperformance among Premier League clubs since 2016.
- 1.85 – Michael Carrick's average points per game as manager, compared to an expected average of 1.37.
- 1.37 – Carrick's expected points per game over his tenure.
- 3 – Points fewer than expected that United have taken this season under Carrick.
- 71 – Points earned in last season's third-placed finish, with an expected total of 61.
- 8 – Number of times in the last 10 seasons that United have finished higher than expected.
- 9th – United's average expected finishing position between 2021/22 and 2025/26.
- 14th – Where they should have finished in 2023/24 under Erik ten Hag, when they actually finished eighth.
- £1.4bn – Net spend since 2016, 40 per cent higher than any other club.
- 8 of 10 – Seasons in which United's net spend rank was higher than their expected points rank.
- 0 – Seasons in which their expected points rank was higher than their net spend rank.
- Only Spurs – Have a higher negative difference between squad cost and value than United among Premier League clubs.
- 6 – Clubs, including United, whose squad value is lower than its cost; the majority have created value.
What was said
"The reason people are there in the dressing room is because someone recommended them. Michael Carrick hasn't picked all those players out on that pitch. That's not Michael Carrick's job. So, who's the head of recruitment? Who's the sporting director? That's where all eyes should be looking now."
Neville's comments cut to the heart of the issue: the men in the dugout are being judged on a squad assembled by others. The focus is shifting upstairs, where Christopher Vivell and Jason Wilcox hold the key roles.
Wilcox, in particular, has faced public criticism from defender Lisandro Martinez after the recent Champions League defeat to Atletico Madrid. Since Wilcox's arrival in April 2024, initially as technical director, success in the transfer market has been limited.
Analysis: Why Carrick deserves time and recruitment is the real problem
The statistics paint a clear picture: Manchester United's managers have consistently extracted more from their squads than the underlying performance data suggests they should. Michael Carrick has averaged 1.85 points per game from an expected average of 1.37 – the largest overperformance of any United manager since 2016. Even Erik ten Hag, Ralf Rangnick, Jose Mourinho and Ole Gunnar Solskjaer overperformed relative to expected points. Ruben Amorim is the only exception.
Yet the flip side is damning. United's average expected finishing position between 2021/22 and 2025/26 is ninth. Their eighth-placed finish in 2023/24 should have been 14th. The squad simply isn't good enough to challenge for titles, and the blame lies with recruitment. Since 2016, United's net spend of £1.4bn is 40 per cent higher than any other club, but their expected points rank has never been higher than their net spend rank in any of the last 10 seasons. Expensive signings like Manuel Ugarte, Matthijs De Ligt, Leny Yoro, Joshua Zirkzee and Benjamin Sesko are yet to justify their price tags. Others, including Rasmus Hojlund, Antony, Jadon Sancho, Raphael Varane and Romelu Lukaku, predate the current regime but add to the cumulative waste. According to Transfermarkt's fees paid and valuations, only Spurs have a higher negative difference between squad cost and value than United. Until the club resolves these recruitment issues, managers will continue to pay the price.
Talking points
- Should United stick with Carrick and blame recruitment instead of making another managerial change?
- Is Gary Neville right to point the finger at Vivell and Wilcox, or are the managers still accountable?
- How can United's net spend be so high yet their squad value so low? Is it the worst recruitment in the league?
- With an average expected finish of ninth, are United now genuinely a mid-table club?
What happens next
Manchester United's next fixture is not specified in the source, but the immediate focus is on the club's response to the Bournemouth defeat. The board considered making a fourth managerial change in four years but has given Carrick a stay of execution. All eyes will be on the next match and whether the underlying numbers finally translate into performances.
Frequently asked questions
How many points have Manchester United overperformed by since 2016?
They have taken 56 more points than expected, with 669 actual points compared to an expected total of 613.
Who is Manchester United's head of recruitment and sporting director?
Christopher Vivell is the head of recruitment and Jason Wilcox is the sporting director.
What is Michael Carrick's points-per-game record as Manchester United manager?
Carrick has averaged 1.85 points per game from an expected average of 1.37 during his tenure.
Related Articles
Filed under: Opinion | LA Premier League Home